Analysis of Support and Resistance Levels for Tesla Stock (TSLA)
Introduction:
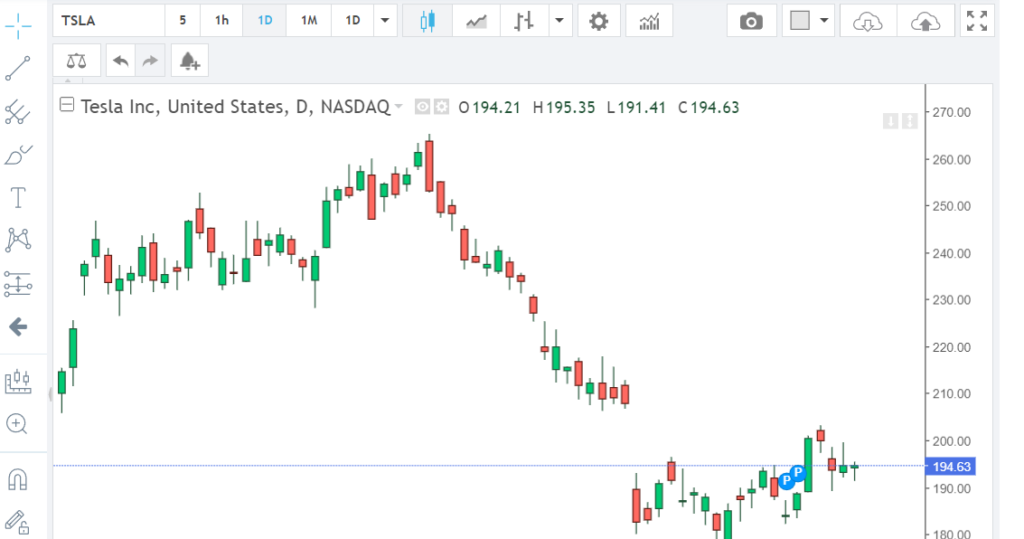
Tesla, Inc. (TSLA) is a renowned electric vehicle (EV) manufacturer and energy company led by visionary entrepreneur Elon Musk. Analyzing support and resistance levels for TSLA stock involves examining key price levels where the stock tends to find buying (support) or selling (resistance) pressure. This analysis aims to provide insights into potential entry and exit points for traders and investors.
Support and Resistance Levels:
Support and resistance levels are fundamental concepts in technical analysis, representing areas where buying and selling pressure are likely to be concentrated. Identifying these levels helps traders make informed decisions about entering or exiting positions.
1. Support Levels:
Support levels are price levels where buying pressure is expected to outweigh selling pressure, preventing the stock from declining further. These levels are typically identified by previous lows or areas where buyers have historically stepped in.
For TSLA stock, several support levels can be identified based on historical price action and technical analysis. One significant support level is around the $600 mark, which has frequently acted as a strong support zone. This level represents a crucial psychological and technical support area, attracting buying interest from investors looking to accumulate shares at relatively lower prices.
Another important support level for TSLA stock is around the $550 mark, which has also served as a reliable support zone in the past. This level may coincide with key moving averages or chart patterns, further reinforcing its significance as a support zone.
2. Resistance Levels:
Resistance levels, conversely, are price levels where selling pressure is expected to outweigh buying pressure, causing the stock price to stall or reverse direction. These levels are often identified by previous highs or areas where sellers have historically been dominant.
For TSLA stock, resistance levels can be identified based on historical price action and technical analysis. One notable resistance level is around the $800 mark, which has frequently acted as a strong barrier to further price appreciation. This level may attract selling interest from traders looking to take profits or initiate short positions, potentially causing the stock price to retreat.
Another important resistance level for TSLA stock is around the $900 mark, which has also served as a significant barrier in the past. This level may coincide with key Fibonacci retracement levels or other technical indicators, further strengthening its significance as a resistance zone.
Technical Indicators:
In addition to support and resistance levels, technical indicators can provide further insights into the strength and direction of price movements for TSLA stock. Commonly used indicators include moving averages, relative strength index (RSI), and MACD (Moving Average Convergence Divergence).
For example, a bullish signal may be generated if TSLA stock price breaks above a key resistance level accompanied by increasing trading volume and bullish divergence in technical indicators like RSI or MACD. Conversely, a bearish signal may be indicated if the stock price fails to break above resistance levels and shows signs of weakening momentum, accompanied by increasing selling pressure.
Conclusion:
In conclusion, analyzing support and resistance levels for TSLA stock provides valuable insights into potential entry and exit points for traders and investors. By identifying key price levels where buying and selling pressure are concentrated, traders can make informed decisions about when to enter or exit positions. Additionally, incorporating technical indicators can help confirm signals and provide further guidance in predicting price movements. However, it’s essential to note that technical analysis is not foolproof and should be used in conjunction with other forms of analysis and risk management techniques.